
The Property Data Report is produced by the Property Industry Alliance annually, and sets out some key facts and figures about commercial real estate in the UK for the preceding year.
Property Data Report 2015
1. Commercial property: size by comparison to other assets
The definition of commercial property includes retail, office and industrial (warehouses and most forms of factory), plus ‘other commercial’ types of real estate typically used for business purposes such as leisure (cinemas, fitness clubs and gyms, leisure parks, etc.), hotels, petrol stations and other miscellaneous types.
The worth of the UK’s stock of commercial property rose to £787 billion in 2014. The 15% increase over the year largely reflected a rise in property prices, driven by the willingness of investors to pay more for a given rent as the UK economy recovered and confidence returned. The stock of commercial property represents 10% of national net wealth. Privately rented residential property accounts for a further 12% of the UK’s net wealth.
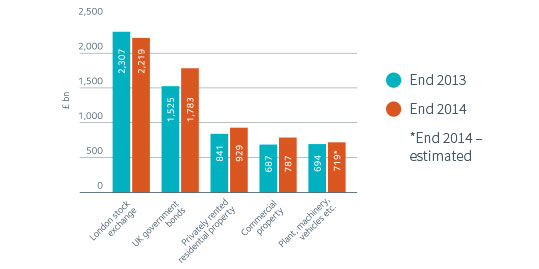
Commercial property’s value is comparable to the country’s stock of machinery, equipment and vehicles and is the equivalent of 35% of the value of the UK’s stock market and 44% of government bonds.
2. Commercial property: size in the built environment
Commercial property accounts for 13% of the value of all buildings in the UK. Other non-domestic buildings – mainly healthcare and educational facilities – constitute a fraction of the value of commercial property.
The UK’s commercial property floorspace in total measures 7.35 billion square feet.

Residential property dominates the built environment, being over six times greater in value than commercial property. Within the residential sector, the private rented sector (PRS) accounts for £929 billion. While the PRS is dominated by smaller private landlords, many institutional and large corporate investors are showing increasing interest in it as a sub-sector of commercial property.
3. Commercial property in detail
Retail (comprising shopping centres and out-of-town retail warehouses and parks, as well as food and department stores and high street shops) is the largest sub-sector, accounting for 43% of the total value of commercial property in 2014.
In the office sector, London dominates, with the capital’s offices representing 64% of the sector’s total value but only a quarter of its floorspace.
Hotels form the largest part of the fast-growing ‘other commercial property’ sub-sector.

Overall, London accounts for 36% of the total value of UK commercial property, compared to its 23% share of GDP. London’s share of commercial property has grown from 26% in 2004, mainly because its property values have risen by almost three-quarters, whereas values in the rest of the country are broadly unchanged, despite the rising market in the period leading up to the financial crisis of the late 2000s.
4. Commercial property: value trend
Since 2000, the value of the UK’s commercial property stock has grown at an annualised rate of 3.2%, slightly ahead of inflation.
All other parts of the built environment have grown at a faster rate than commercial property. In particular, the value of the stock of residential property has grown much more quickly, at 6.2% per annum, reflecting greater increases in both values and the stock of housing. Notably, the number of flats and houses in the UK has grown annually at more than twice the rate of commercial floorspace.
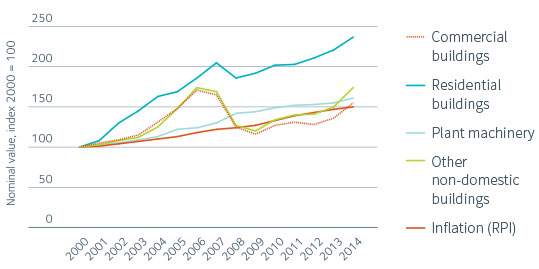
The value of machinery, equipment and vehicles in the UK has, over the cycle, grown at a similar rate to commercial property.
5. Renting versus owning
Over half of the UK’s commercial property is rented by occupiers, in contrast to residential property, where almost two-thirds is owner-occupied.
With many businesses increasingly reluctant to commit capital and management time to the owner-occupation of their property and with investors having a healthy appetite for commercial buildings, renting grew significantly during the last decade.
The proportion of commercial property that is rented has stabilised since the late 2000s downturn in the economy.
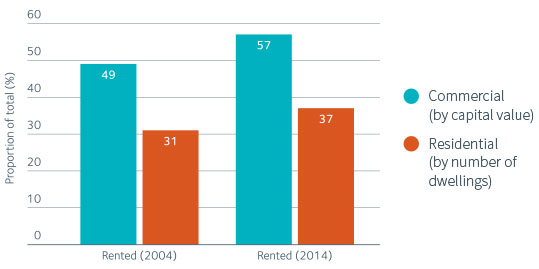
The renting of homes declined in the period leading up to the early 2000s but since then it has been growing, reflecting in particular a doubling in the proportion of those who are renting privately. Privately rented housing now accounts for 19% of the value of the UK’s housing stock, according to the IPF’s The Size and Structure of the UK Property Market End–2014 Update. Commercial property investors are increasingly interested in residential property as an investable asset.
6. Commercial property: leases
The average length of a new lease has fallen substantially over the last 15 years, most so during the first half of the 2000s. Before accounting for tenant break options (which were included in the 2014 report), the average length is now 6.8 years, compared to 9.6 years in 1999. This change is most pronounced in the retail sector, and reflects the preference among many, especially smaller, occupiers for greater flexibility in their property arrangements.
Other tenants, particularly bigger businesses and those in better quality buildings, continue to prefer longer leases because of the security of tenure and high fit-out costs. This in turn is encouraged by investors seeking income security and inflation protection over the long run.

27.5% of leases signed in 2014 incorporated break clauses; including these breaks reduces the average lease length by about a further two years. Break clauses tend to be most common in properties with leases of 6-15 years’ length but are less likely in those with longer lease lengths – emphasising the continuing importance some tenants place on security of tenure.
7. Commercial property as a business cost
Rents account for a relatively low proportion of business costs. Office rents, at £15 billion, are low (7%) relative to staffing costs.
The rental costs to retailers, of £18 billion, are a third of the level of staff costs. They represent a small fraction (about 5%) of retailer turnover.

Business rates on average add some 40% to the cost of renting retail and office property, although the burden across occupiers has become uneven in recent years. Business rates have become a more significant property cost in recent years, as described in Section 8.
8. Commercial property as a business cost: inflation
Rental values, on the whole, have increased at a much slower rate than other business costs over the last 10 years, well below the rate of retail price inflation.
There is a contrast, however, between the retail sector, where rents have barely changed over the last 10 years, and offices where (because of the buoyant London market) rents have grown relatively quickly, albeit still below inflation.

Business rates have increased at a faster rate than rents and, on average, in line with inflation. In the retail sector, the divergence with sluggish rental growth is substantial; business rates have also grown by far more than the rise in sales turnover recorded in retail property.
9. Investor ownership of commercial property
£449 billion (i.e. 57% of the total) of commercial property in the UK is owned by investors rather than occupiers.
UK institutions (insurance companies and pension funds) were traditionally the biggest investors in UK commercial property but now account for less than one-fifth of the total, down from almost one-third in 2004.
Overseas investors now own a quarter of UK commercial properties held as investments (but still well below the 50%+ level of overseas ownership in the UK equity market). Their commercial property holdings have grown rapidly over the last decade.
These estimates exclude residential and student accommodation. Large (commercial/institutional) investors own about £24 billion of such property. However, more than £900 billion is in the hands of small private property companies and private landlords.

In aggregate, UK and overseas collective investment schemes now own over a quarter of the amount invested in UK commercial buildings and, collectively, represent the largest owner type, according to recent research for the IPF.
10. UK institutional investor exposure to commercial property
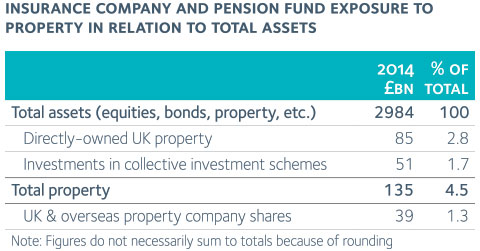
Property, in one form or another, accounts for around 6% of the £3 trillion in total invested by UK institutions (insurance companies and pension funds). Property’s share grew in 2014, mainly because values increased more rapidly than in other asset classes.
Until the 1990s, these institutions tended to obtain their exposure to commercial property almost entirely through direct ownership of buildings. Today, although direct ownership (in accounting for almost 3% of their total investments) remains dominant, investors deploy a wider range of approaches.
Investments in collective investment schemes have grown as larger investors have used them to complement their direct holdings and gain access to specialist skills, while they have enabled smaller pension funds to gain an exposure to an asset class previously accessible only to big investors.
Institutions have also traditionally invested in property through their equity investments in REITs and listed property companies.
Another growing form of investment is debt, which insurers have increasingly been providing to other property investors. Estimates by De Montfort University indicate that such lending by insurance companies and their (largely institutionally-backed) fund management arms increased by almost 40% between the end of 2012 and 2014, such that the amount invested now rivals their exposure to REITs and listed property companies.
11. Commercial property lending
Most investors, other than institutions, and many occupiers acquire commercial property using a combination of their own capital (equity) and external debt.
UK banks and building societies were traditionally the principal lenders but their dominant position has been rapidly eroded in the years since the financial crisis. They now account for only 39% of new lending and half the value of outstanding loans.
A broader range of debt providers (such as insurance companies and debt funds) has emerged over the last five years. They accounted for 25% of new lending in 2014 and a fifth of all outstanding loans, compared to only around 5% of outstanding loans in 2008.
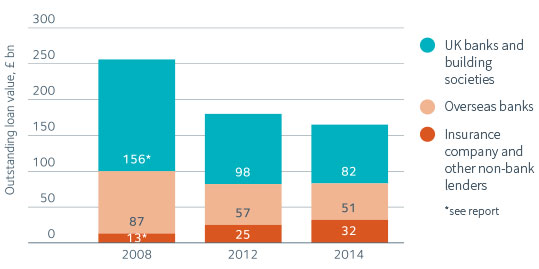
De Montfort University’s latest survey suggests that lending secured on commercial property investment (as defined in this report) is approximately £150 billion, indicating that about one third of the capital invested in commercial property takes the form of debt. This compares with around two-thirds five years ago, a change that resulted partly from deleveraging and partly from the recent recovery in property values.
12. Commercial property: investment performance
Directly-owned commercial property returns further improved to 17.9% in 2014, from 10.6% in 2013 and 3.3% in 2012, and outpaced the FTSE and the gilt market. Direct property’s five year record is now superior to equities and gilts.
Property company shares delivered relatively high returns in 2014. The five-year record is also comparatively good, although property company shares tend to be much more volatile than directly-owned property and other asset classes.
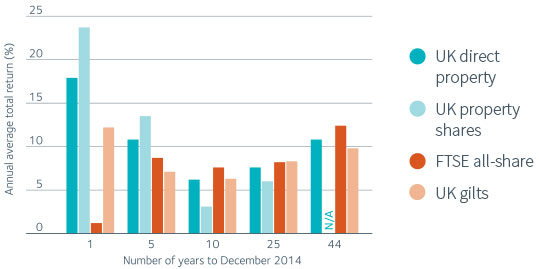
Over the longer term, directly-owned commercial property performance – at 10.8% per annum since 1971 (IPD’s earliest data point) – lies between the returns of gilts and equities. This ranking is in line both with surveys of investors’ longer-term expectations and with the historic pattern of risk – commercial property returns being less volatile than equities but more volatile than gilts.
13. Commercial property: economic contribution
The commercial property industry contributes to the UK economy in many ways. It provides the finance for andundertakes the construction of new buildings. It invests in and manages the accommodation needs of retailers, businesses, distributors, manufacturers, hoteliers and many parts of the public sector. Other bodies within the industry maintain these buildings or facilitate the buying, selling and letting of such property on behalf of owners.
In total, in 2014 these activities (excluding those of owner occupiers) directly contributed about £63 billion to the economy – representing 3.9% of Gross Value Added. This is comparable to the combined size of the UK’s telecommunications and transport industries, highlighting the sector’s importance to business and to people’s everyday lives.
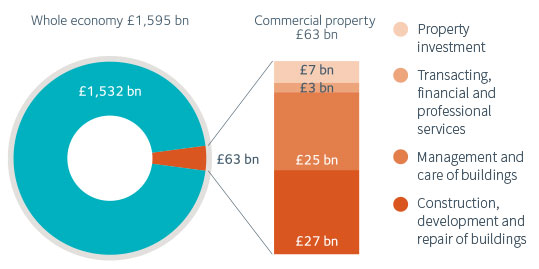
Alternatively, representing commercial property’s economic contribution as the rents paid by tenants and the imputed rents of owner-occupiers, a similar estimate of 3.6% results, rising to 6.2% when privately rented residential property is included in the calculation.
14. Commercial property as a major employer
Nearly a million people are employed by the commercial property industry – about one in every 35 jobs.
Most activity involves the construction, development, repair, care and management of buildings.
The commercial property investment sector (and this of course is before taking account of owner-occupiers) is a small but high value-added part of the industry, and the largest in Europe. It generates around £330,000 value-added per employee – almost eight times the average for the economy as a whole.
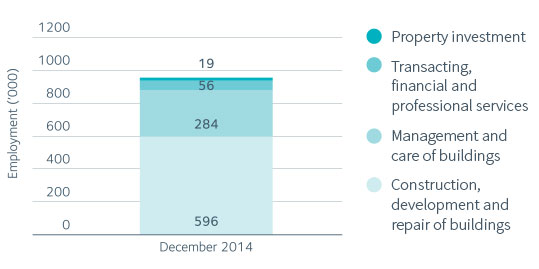
Across the industry, value-added per person averages around £65,000 – 40% higher than the national average.
15. Taxes paid to the National Exchequer
The commercial property industry is taxed both directly and indirectly. The direct contributions from some of these taxes – including Stamp Duty Land Tax (SDLT), VAT, PAYE and National Insurance contributions – can be calculated with reasonable accuracy and are illustrated below.
Such taxes amount to around £15 billion in total, representing almost a quarter of the commercial property industry’s Gross Value Added. This is a greater proportionate tax burden than in the economy as a whole, reflecting the taxation of property transactions through SDLT. Recent research undertaken for the British Property Federation indicates that commercial property is taxed more heavily than residential property.

Other taxes directly paid by the industry, ranging from Corporation Tax to business rates on empty property and the Community Infrastructure Levy, are much harder to assess.
In addition, occupiers of commercial property paid over £20 billion in business rates, some of which is, effectively, borne by property owners through lower rents.
16. Commercial property: regeneration
The commercial property industry, on average over the last decade, has been adding about 54 million square feet of new space every year, i.e. about 0.7% of the total stock of commercial property. This reflects a value of around £12 billion – contributing almost 1% to the UK’s GDP each year.
Activity over the last five years, however, has been running at half the previous rate. This lower rate applies to all the three main sectors – retail, offices and industrial.

The new building is barely covering the loss of stock through demolition and change in use to residential. The net amount of commercial property floorspace has increased in total by only 0.7% over the last 10 years, according to the IPF’s The Size and Structure of the UK Property Market End–2014 Update.
17. Energy consumption
Commercial property accounts for about 8% of the UK’s energy consumption. Other non-domestic buildings, mainly schools, colleges and hospitals, and the heating and lighting needs of factories bring the total used in non-residential buildings to 15%. By contrast, almost a third of the UK’s energy consumption occurs in the home. Transport is the country’s biggest consumer of energy.
Energy consumption in commercial properties fell in 2014, helped in part by the milder winter. By contrast, the use of energy increased in the transport sector.

Shops are the largest consumer of energy in the commercial property sector, reflecting not only a larger amount of space but also greater energy requirements per square foot. Shops, however, tend to be better at conserving energy, having better than average Energy Performance Certificates (EPCs).
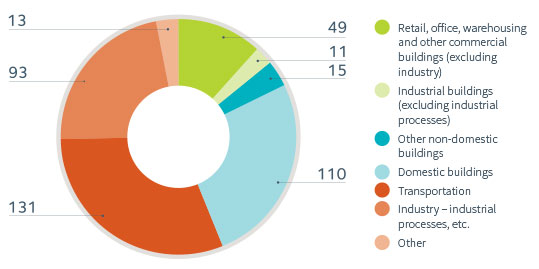
18. CO2 emissions
About 12% of CO2 emissions are directly and indirectly (i.e. emitted in the production of power) associated with consumption by shops, offices, warehouses and other commercial buildings (occupied by both the private and public sectors) with a further 3% accounted for by the heating and lighting of industrial buildings.
Retail outlets, in line with their higher energy consumption, are the biggest emitters within the commercial property sector.
Domestic buildings and transportation are by far the largest emitters of CO2 in the UK.
Direct and indirect emissions from commercial buildings fell in 2014, even after taking into account the unusually mild winter.
Definitions, sources and methodologies, and acknowledgements are available in the full report.
